Chip Swimlane
Chip Swimlane shows the timeline of PyPTO 3.0 tasks from scheduling through AICore execution. The extension reads chip_swimlane_records.json directly; you do not need to convert it to Chrome Trace format first.
Open a swimlane
In the VS Code Explorer, right-click chip_swimlane_records.json and select PyPTO Toolkit: Open File.
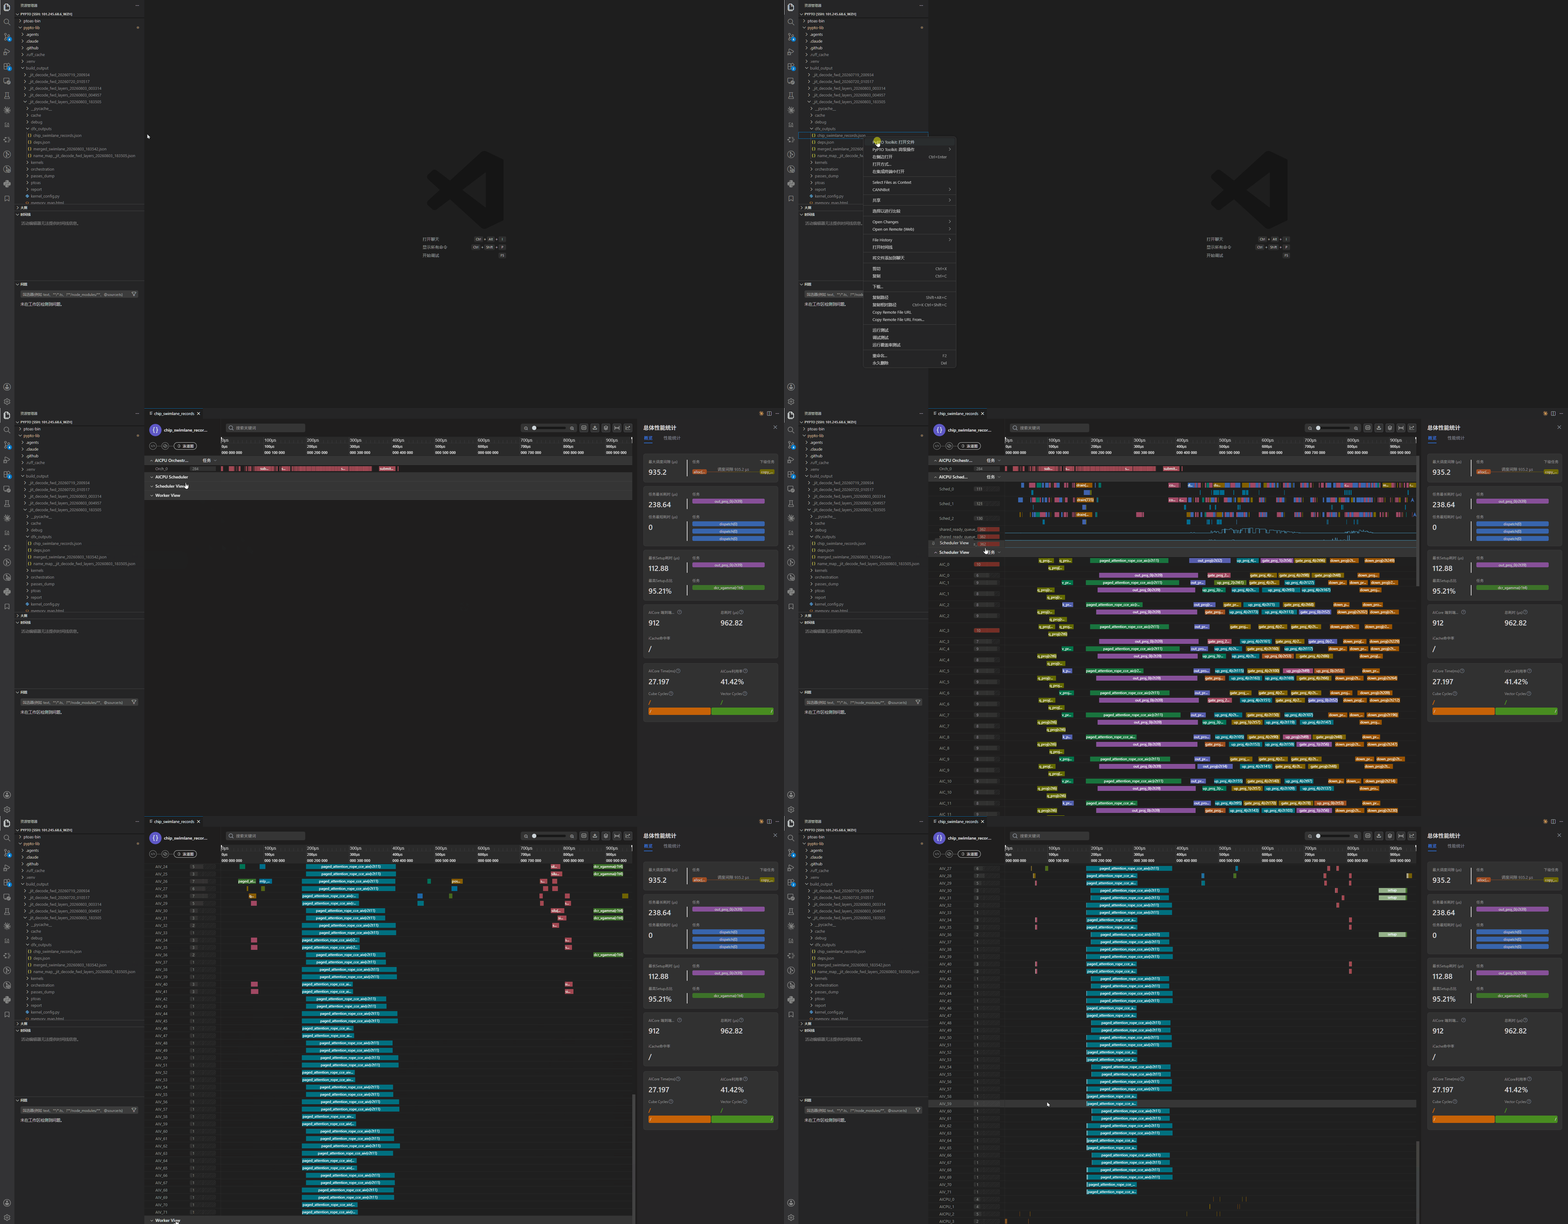
The extension creates views based on the data actually present in the input file:
| View | Description |
|---|---|
| Worker View | Shows task start time, end time, and duration on each AIC/AIV core |
| Scheduler View | Shows AICPU scheduling intervals from dispatch to finish |
| Scheduler Phase | Shows phases such as dispatch, early_dispatch, wire, release, resolve, and drain |
| Orchestrator Phase | Shows orchestrator submission phases and their relationship with the scheduler |
A low record level does not infer higher-level scheduling data. For example, a file containing only worker tasks does not produce a complete Scheduler Phase view.
Inspect task details and dependencies
Select a task to display its timing, Ring/Task ID, function information, setup duration, fan-out, and other details in the lower panel. When deps.json exists in the same directory, the view also displays task dependency lines.
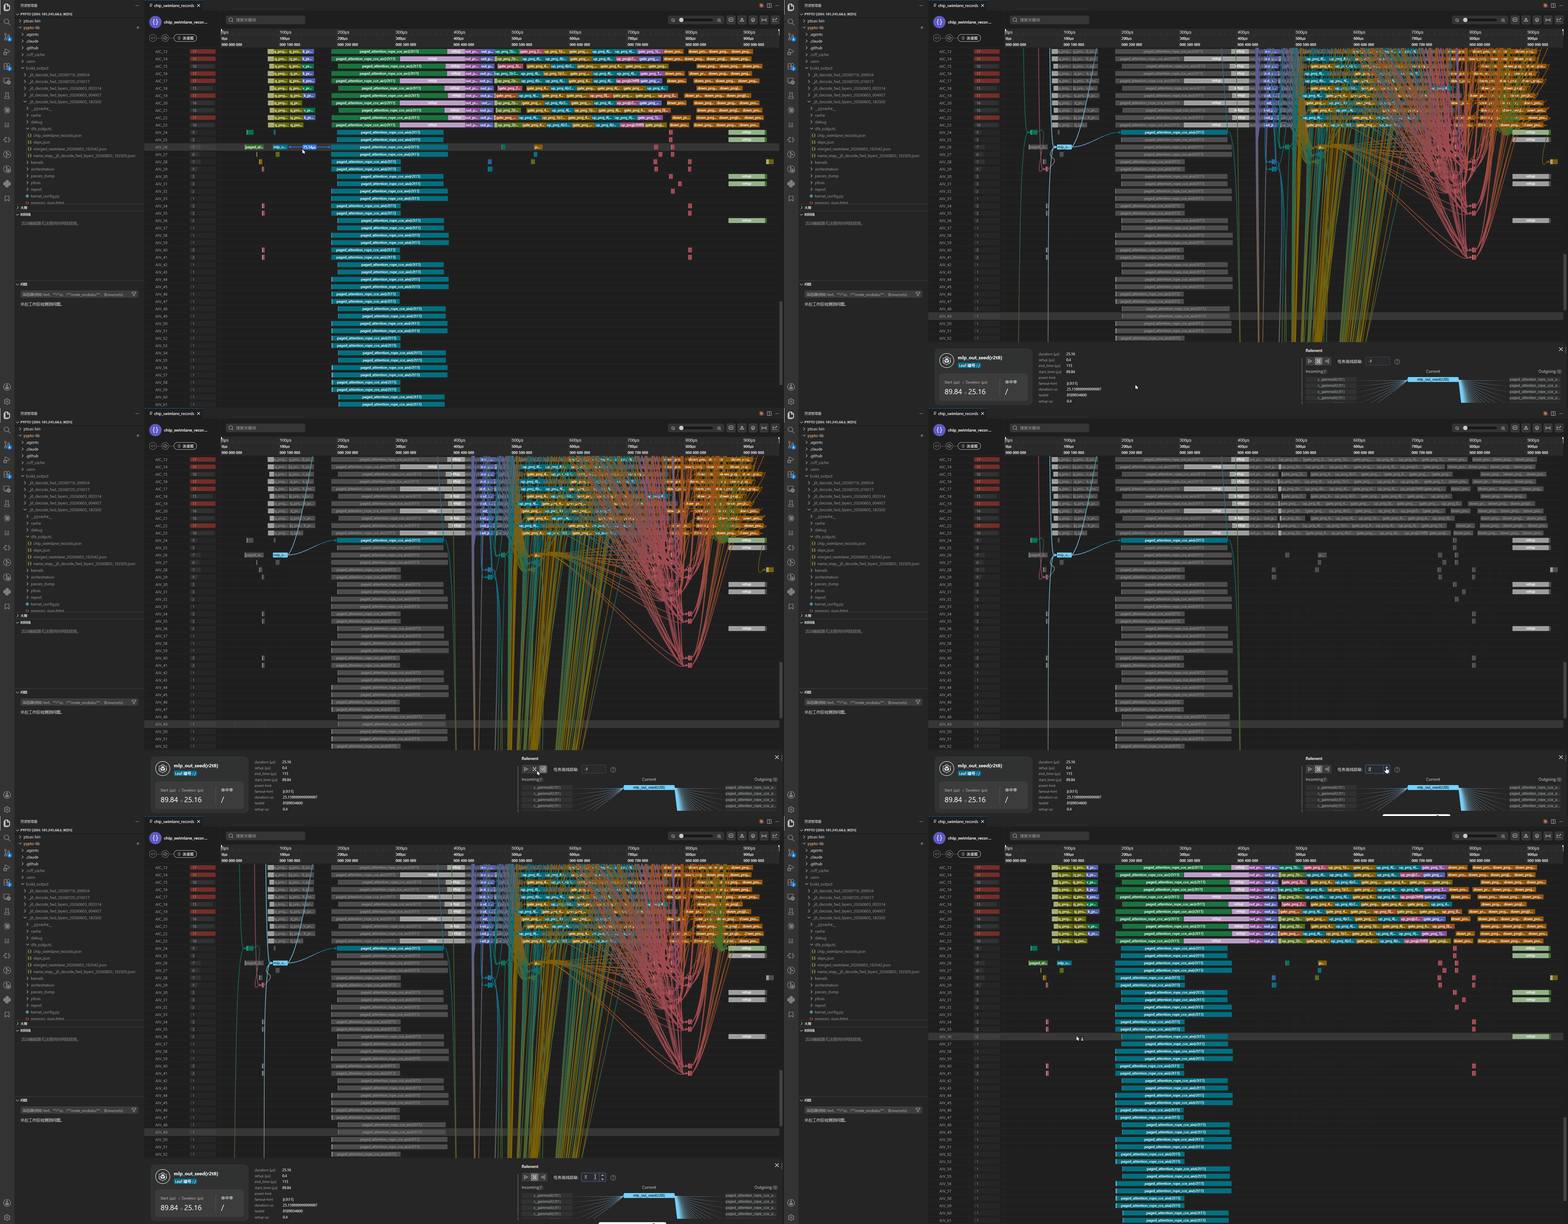
You can configure the dependency depth:
0: do not expand dependencies;- a positive integer: show the specified number of predecessor and successor levels;
- refer to the current extension interface for the available range.
Selecting one SPMD task highlights tasks with the same name. On a dependency path, identically named SPMD tasks are consolidated to prevent excessive lines from obscuring the view.
Search for tasks
Enter a function name or Task ID in the search box to locate tasks with a fuzzy match.
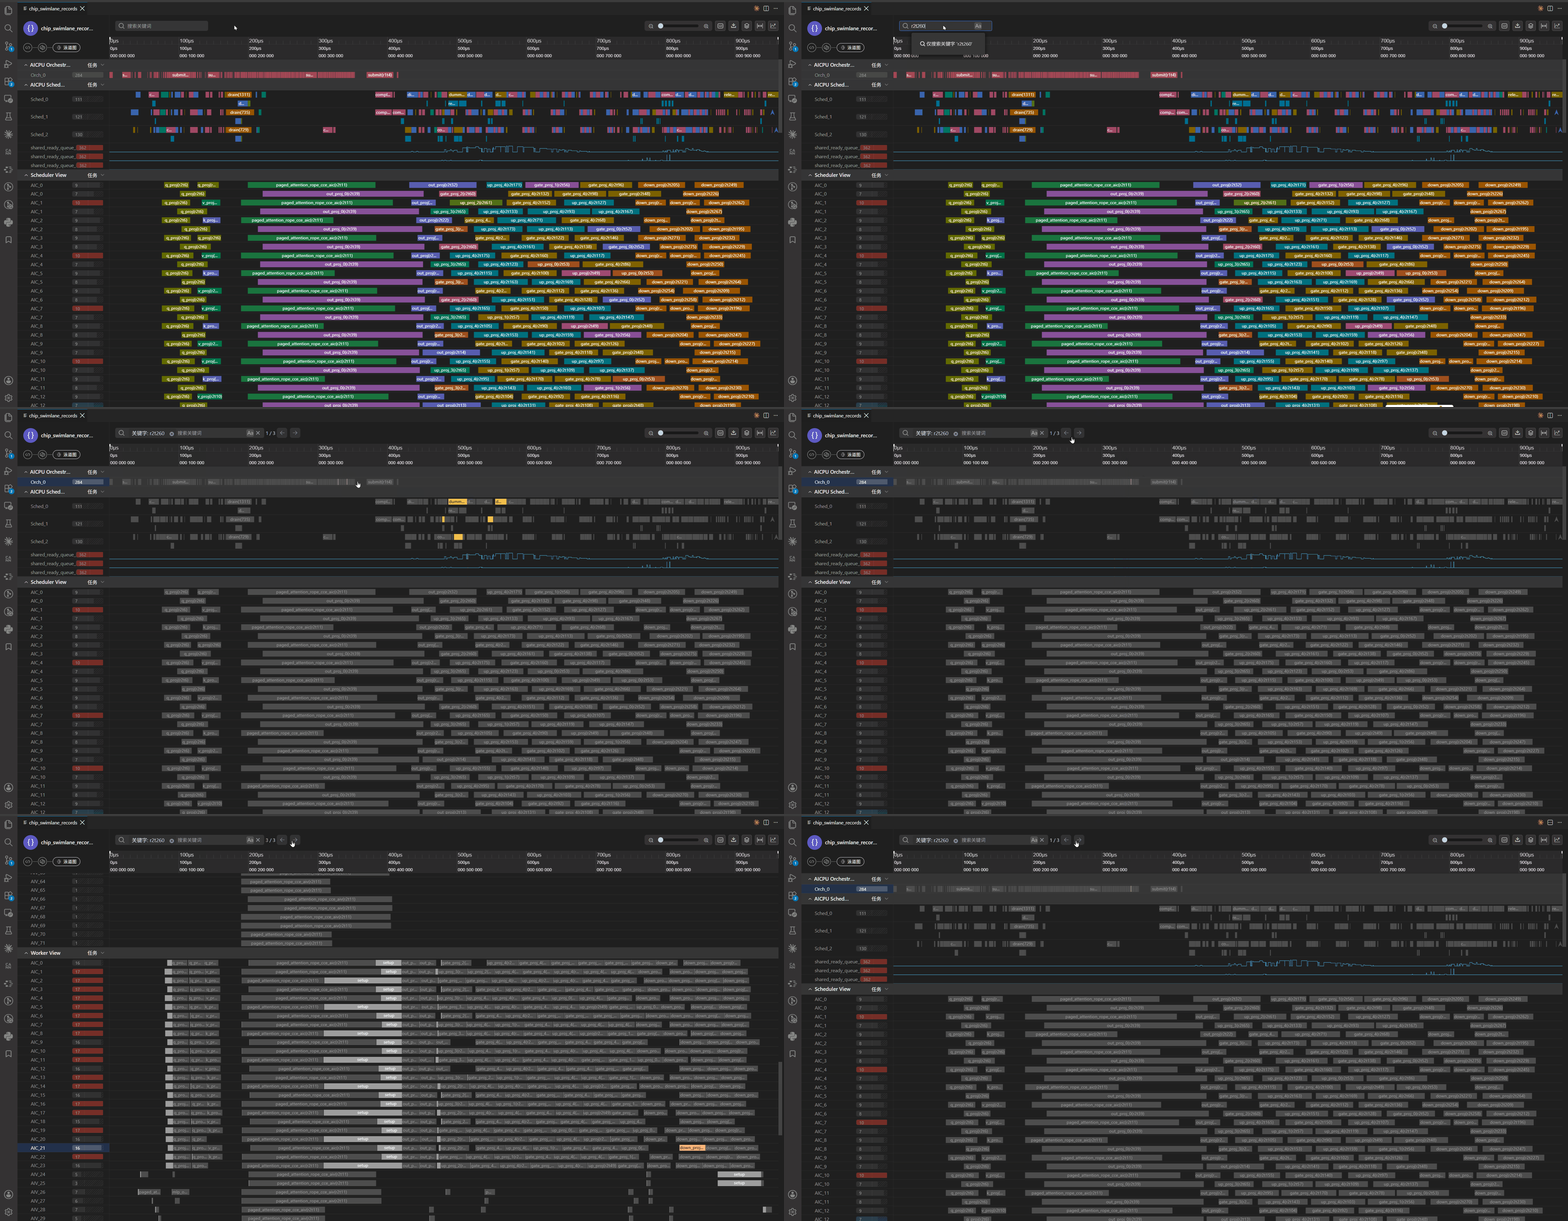
Task labels can show the function name, Ring & Task ID, or both.
Time markers
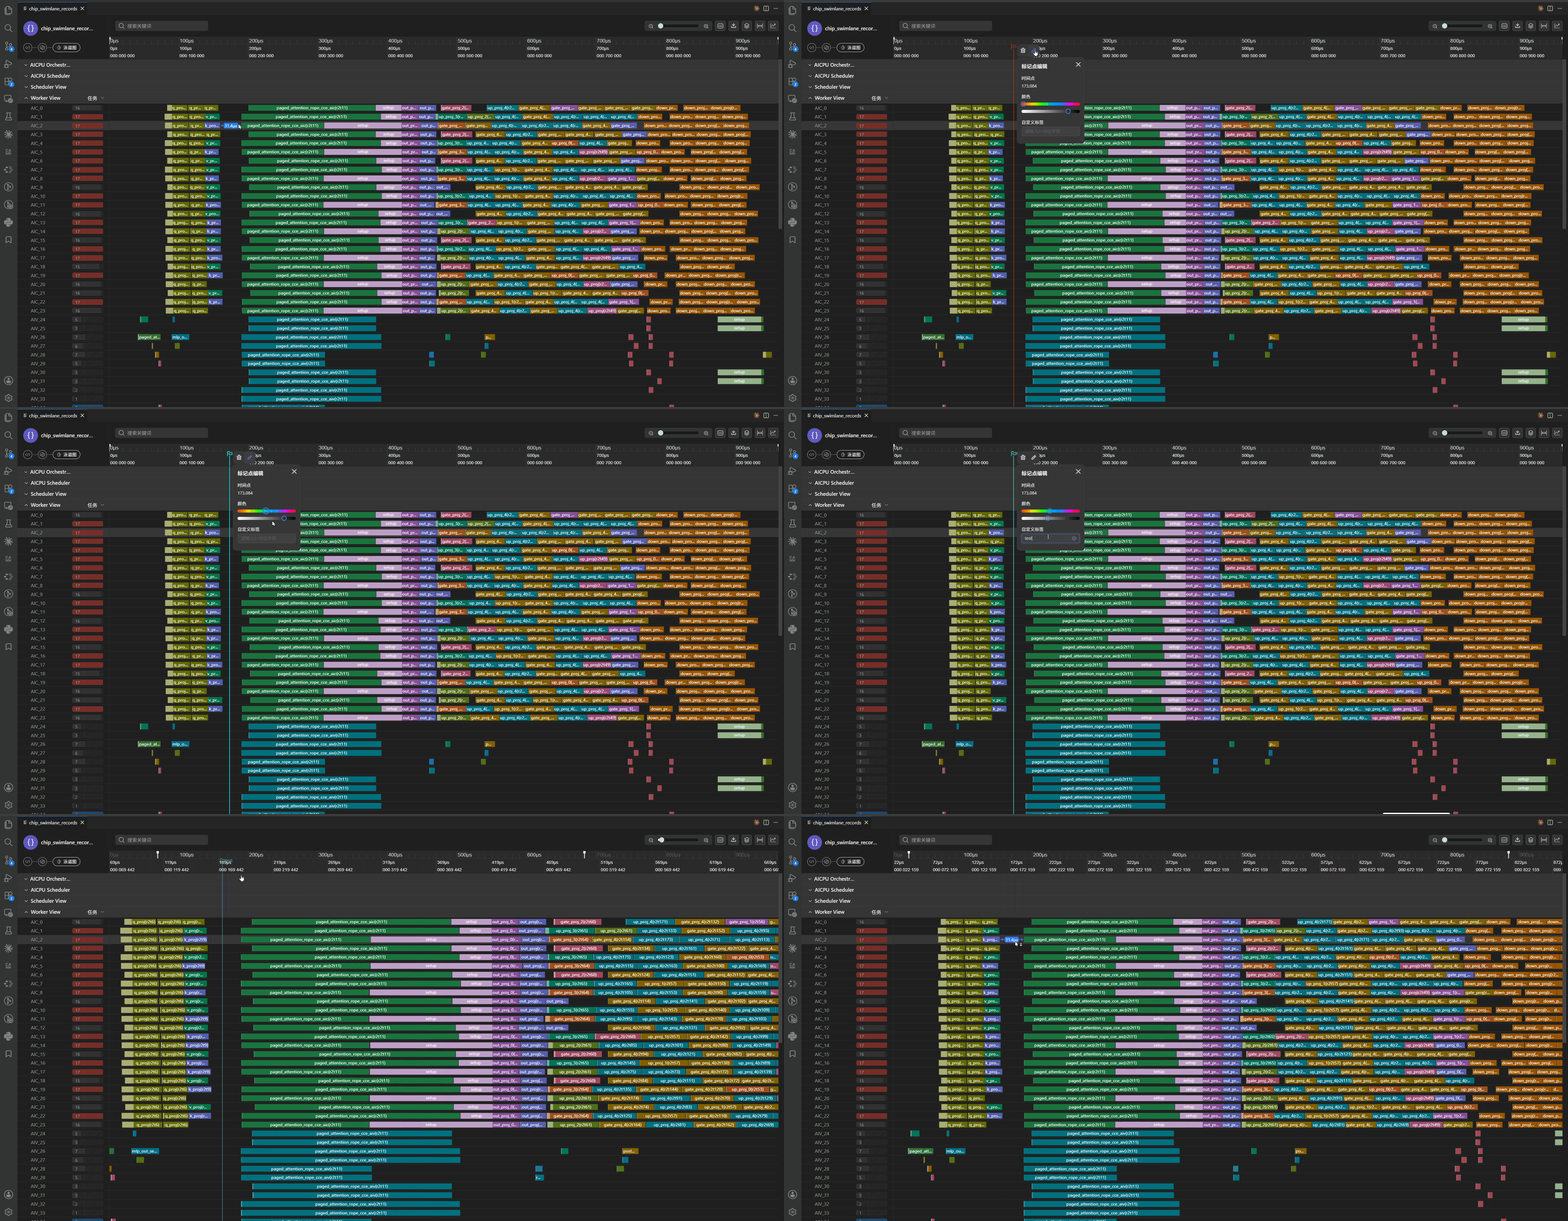
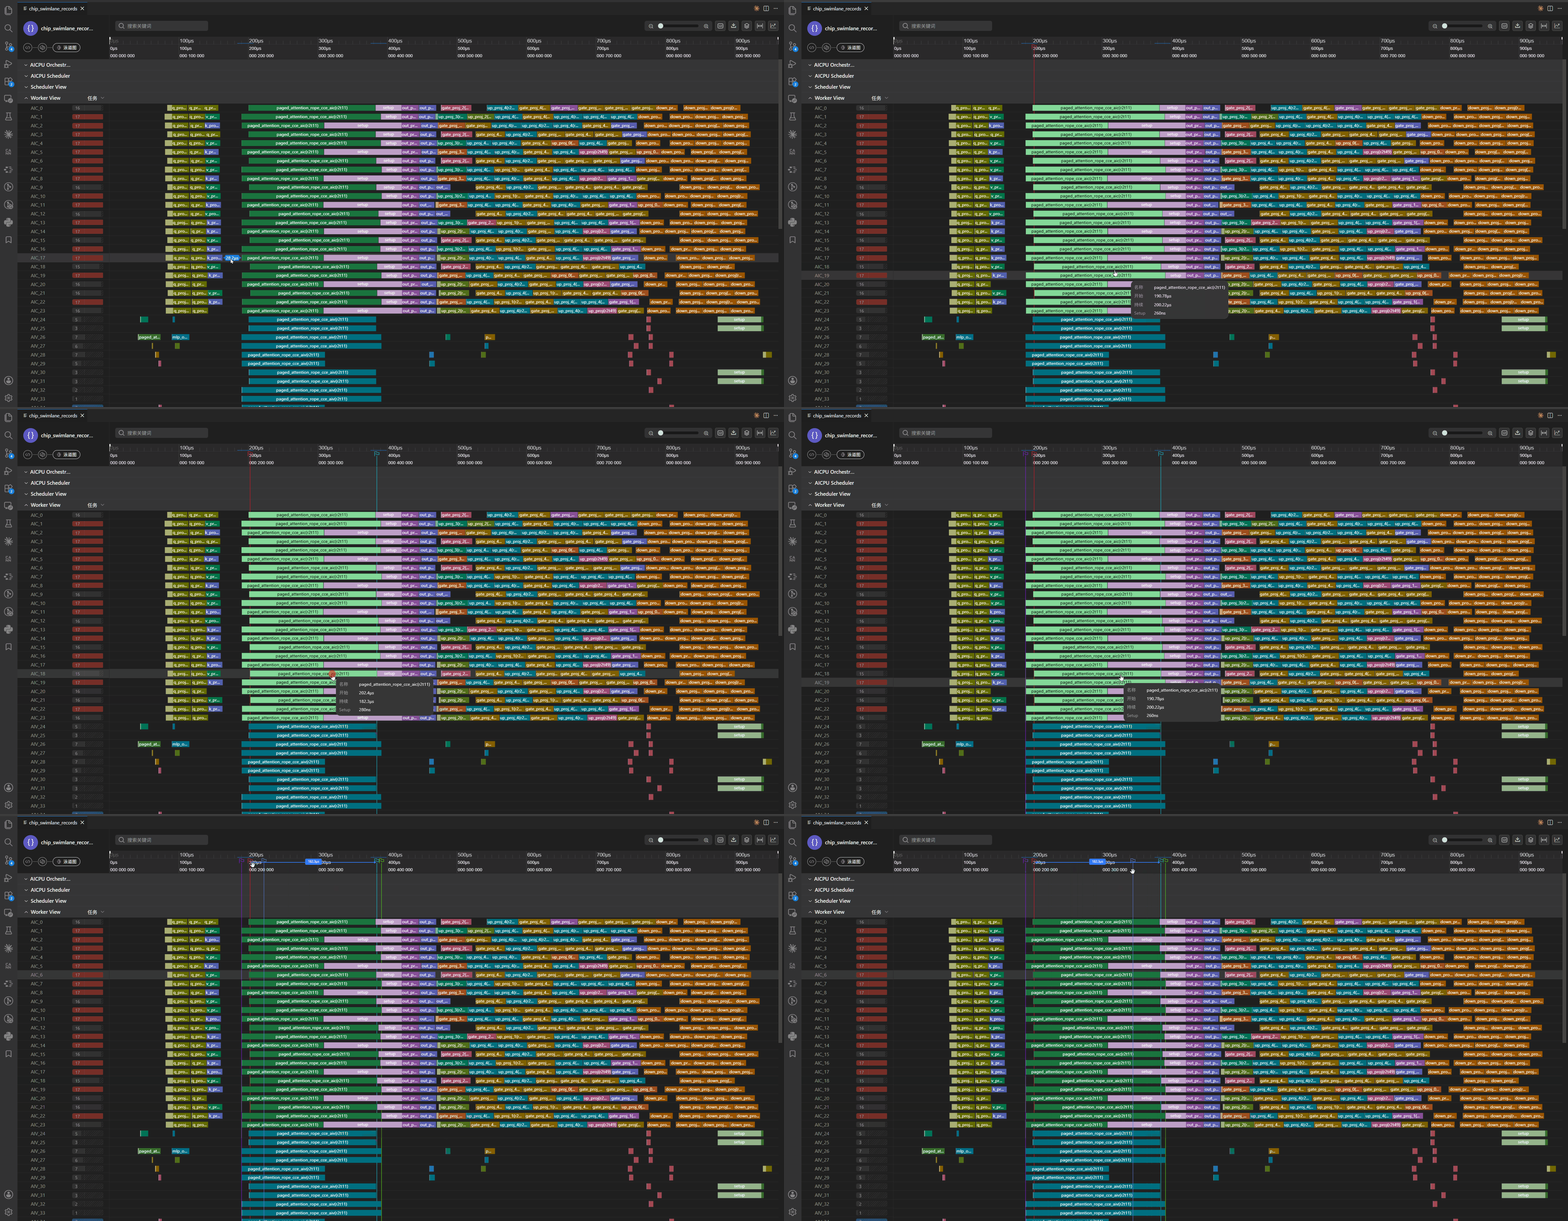
You can add markers on the time axis. You can also right-click a task to draw markers at its start and end, or at the overall boundaries of identically named SPMD tasks. Each marker displays its timestamp. Select a marker again to close its action panel.
Setup analysis
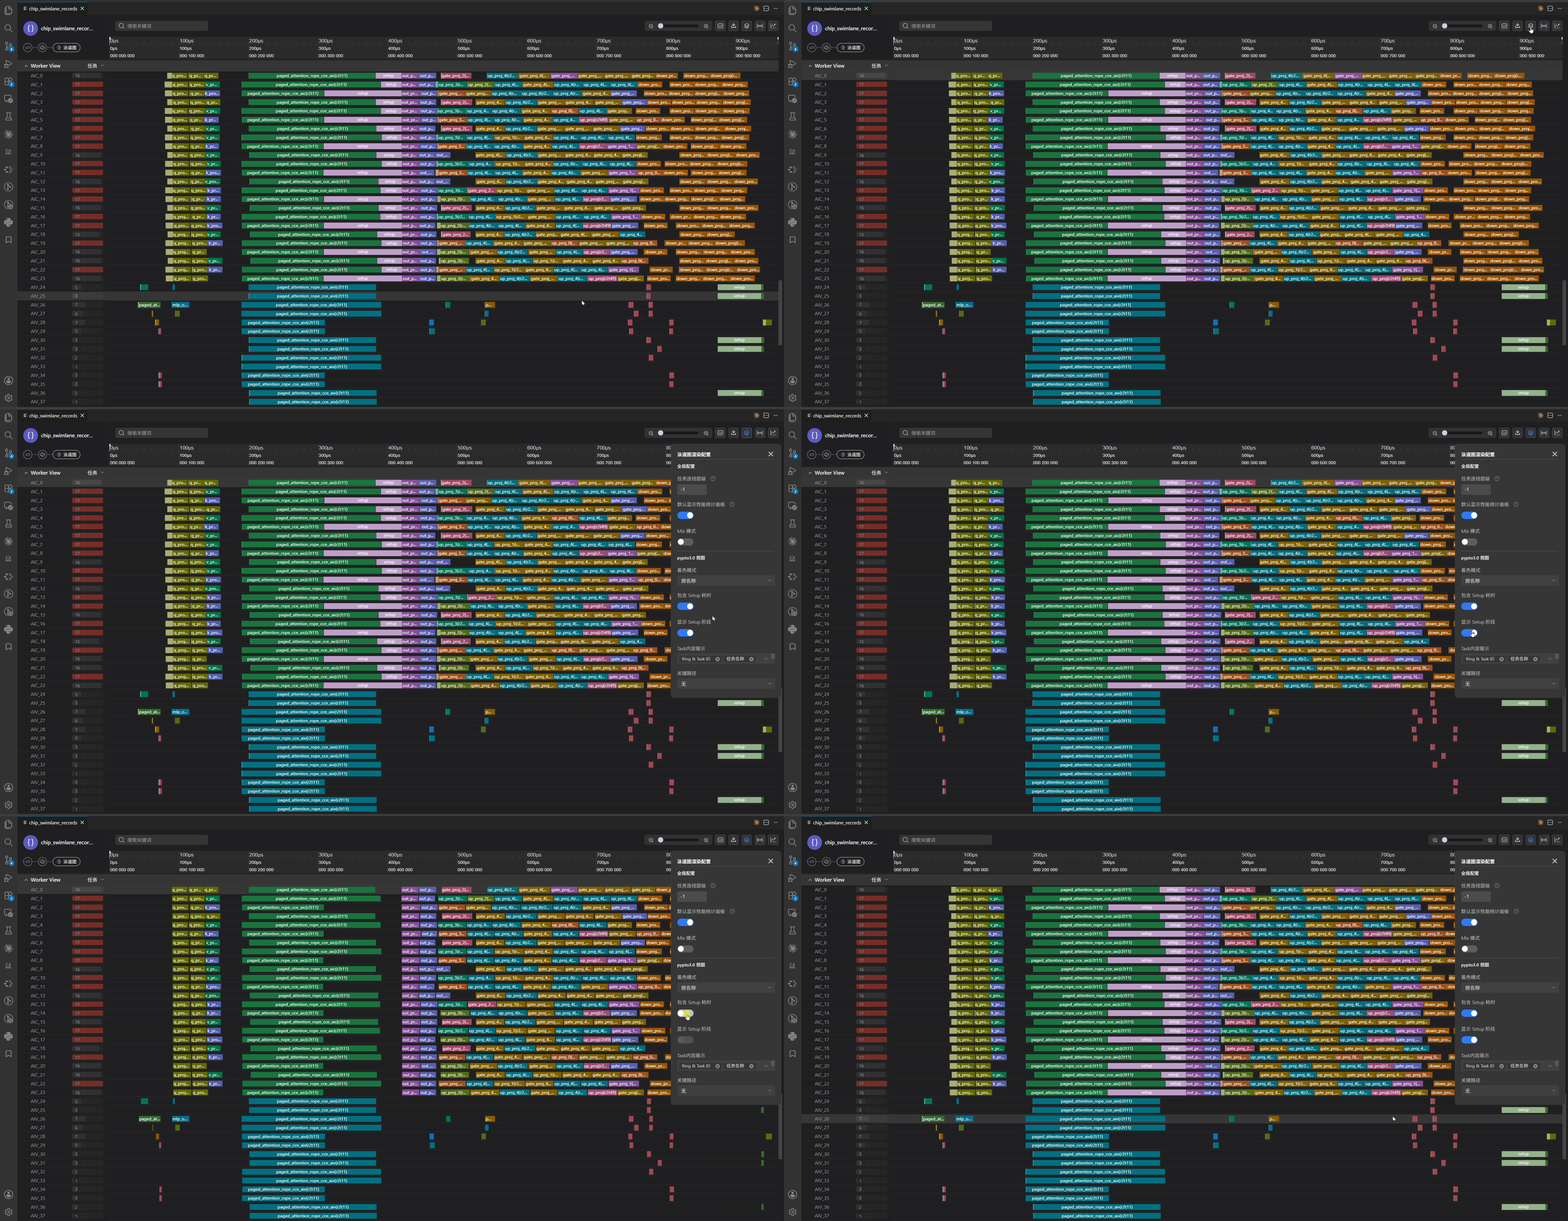
For records that include receive-to-start data, the extension treats the interval from receive to start as local setup:
- renders setup as a separate region in each worker task block;
- lets you configure whether the total duration includes setup;
- lets you hide setup rendering;
- displays setup duration in task details;
- reports tasks with the longest setup and the largest setup ratio in the performance panel;
- excludes setup from function-level kernel duration statistics.
Performance analysis panel
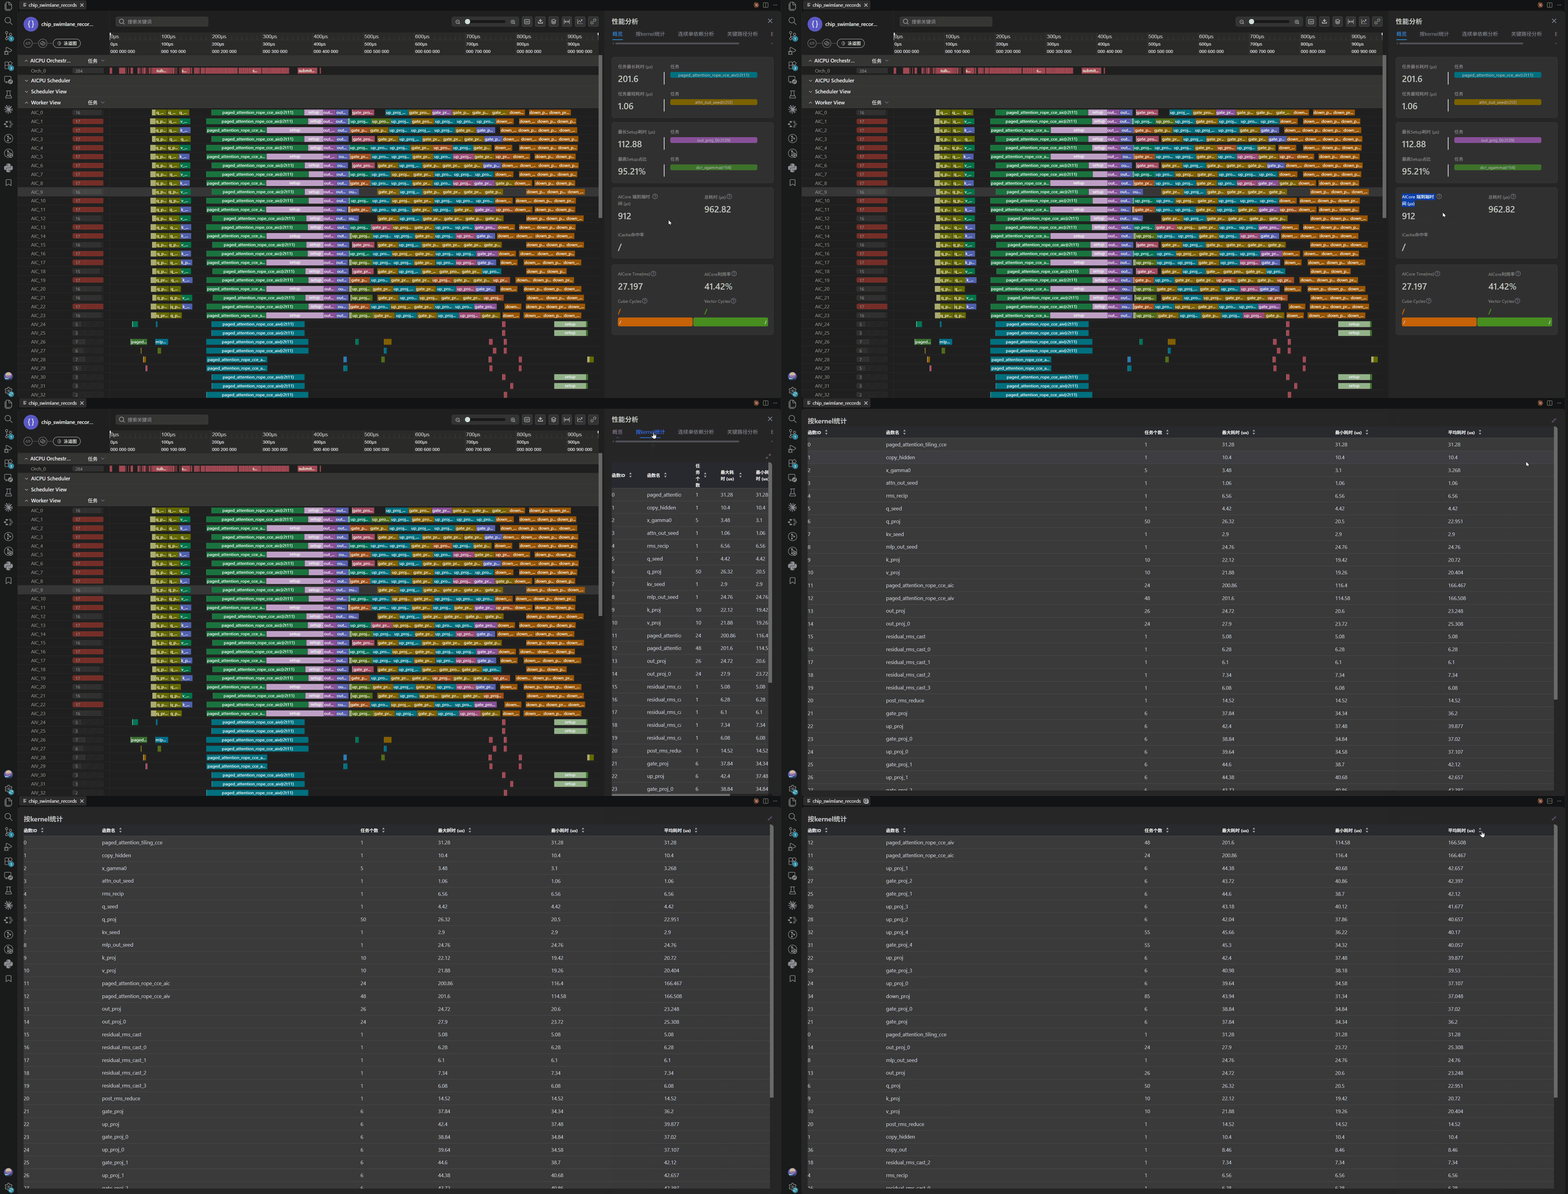
Select Performance Statistics in the upper-right corner to open the performance analysis panel. The panel provides an overview, per-kernel statistics, and several tuning analyses. Selecting a task or task path in the statistics locates and highlights the corresponding records in the swimlane.
Overview and per-kernel statistics
The overview lists key information from the swimlane. Per-kernel statistics group kernels by func_id and report the invocation count and the maximum, minimum, and average duration of a single invocation. Each duration runs from start to end and excludes setup time. Select the icon next to a column header to sort the table by that column.
Continuous single-dependency analysis
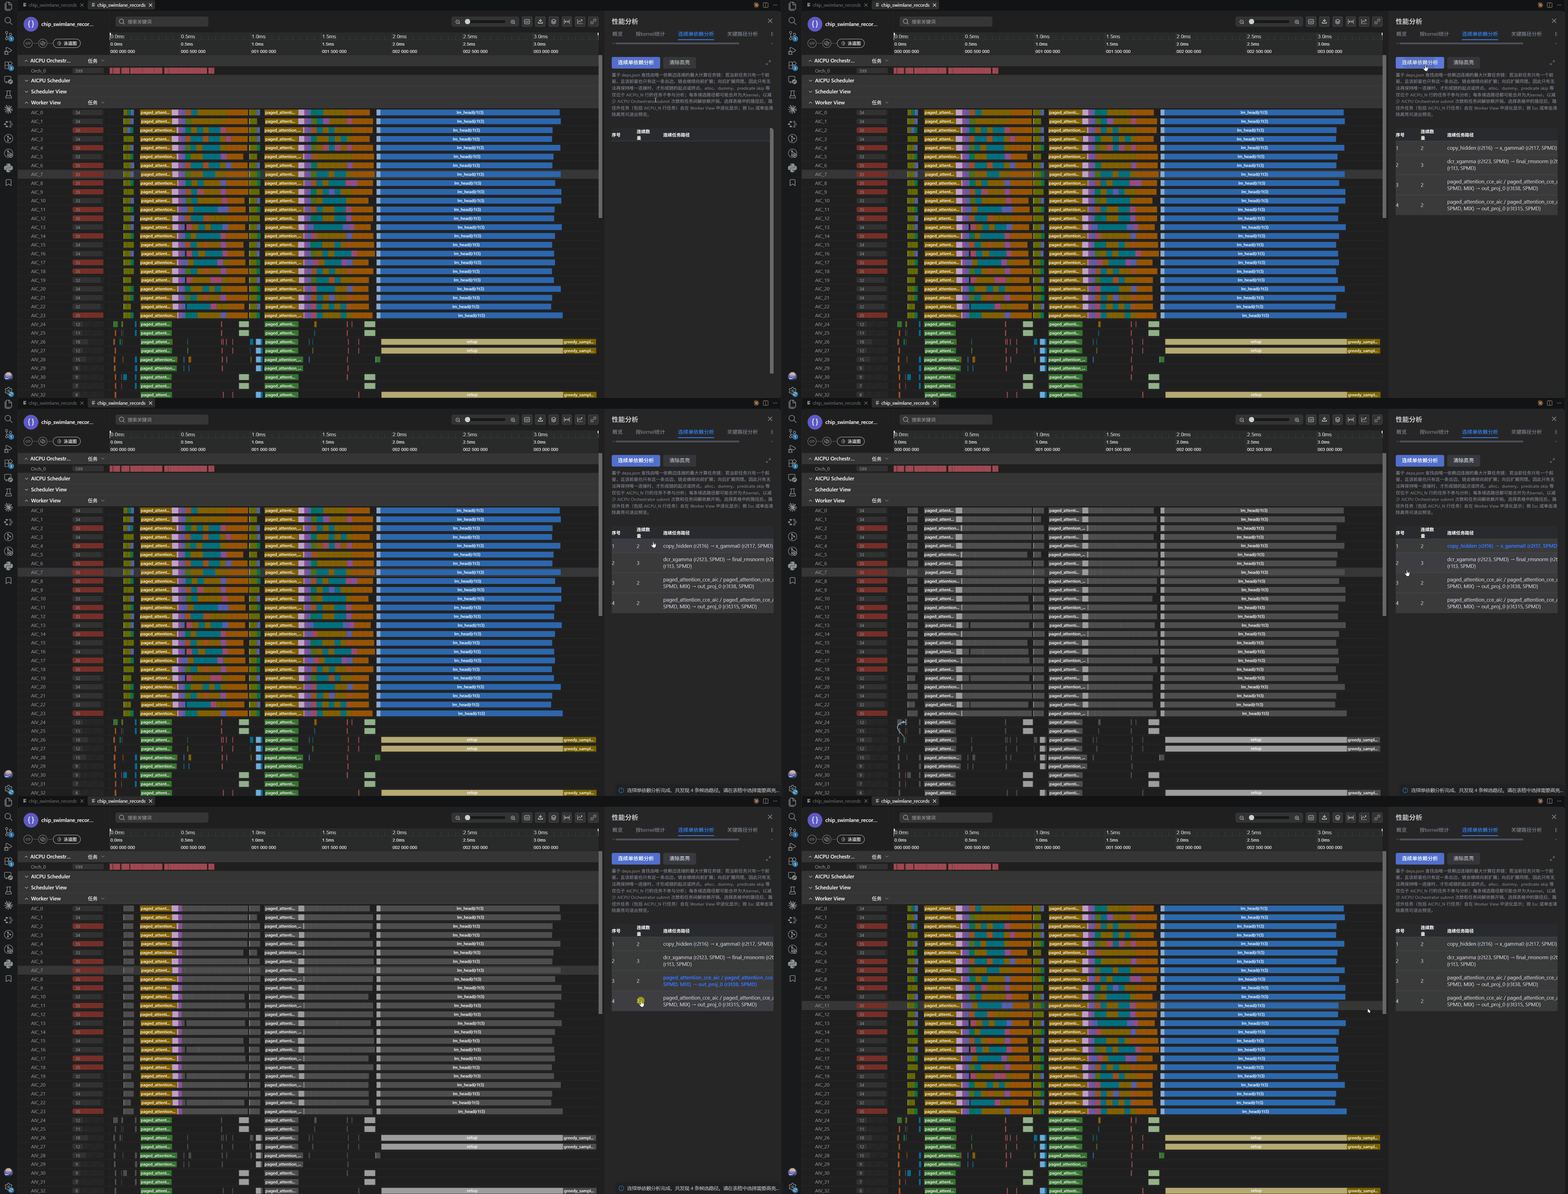
If a task has exactly one predecessor and that predecessor has only this task as its successor, the two tasks may be candidates for merging to reduce scheduling overhead. Continuous Single-Dependency Analysis lists task chains that meet these conditions. Select a task path in the table to highlight the chain in the Worker View and de-emphasize all other tasks.
Critical-path analysis
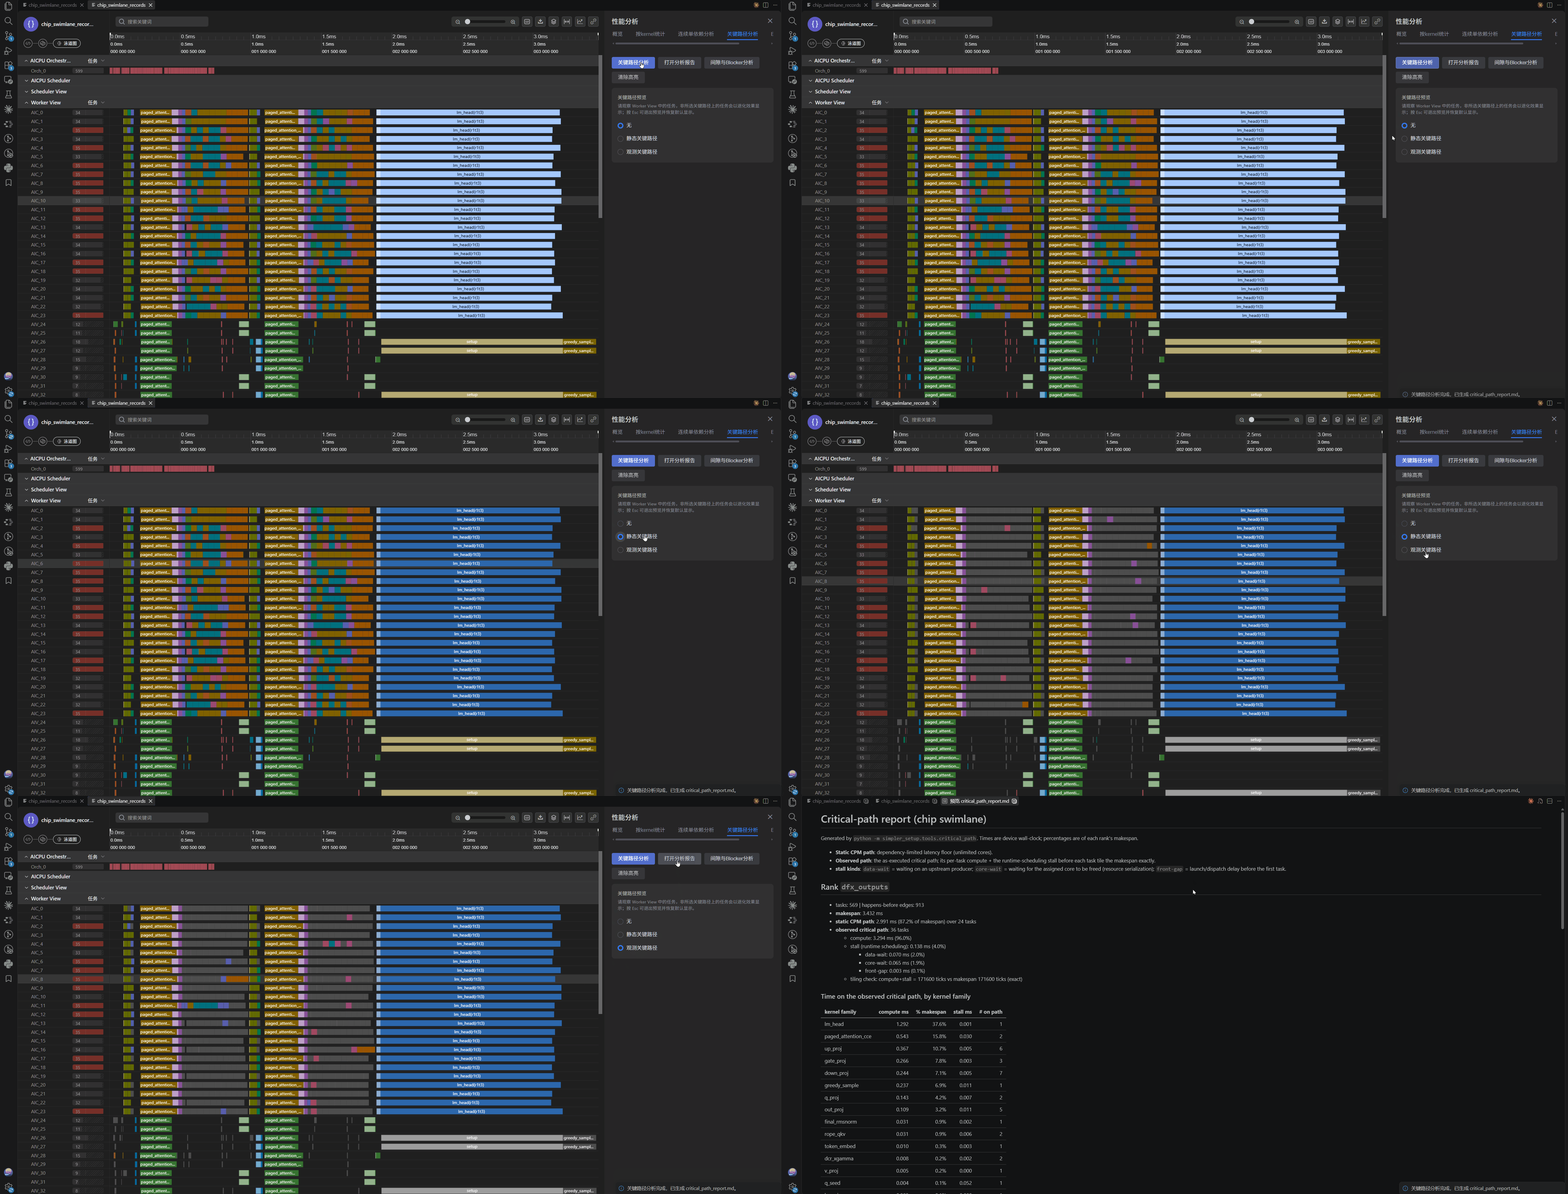
The critical-path analysis script in the simpler repository generates CPM_static*.json or CPM_observed*.json under dfx_outputs. After you select a result, the Worker View highlights tasks on the path and de-emphasizes all other tasks.
Important
The extension only reads and highlights existing CPM results. It does not calculate or generate a critical-path report in the IDE.
Gap and Blocker Analysis
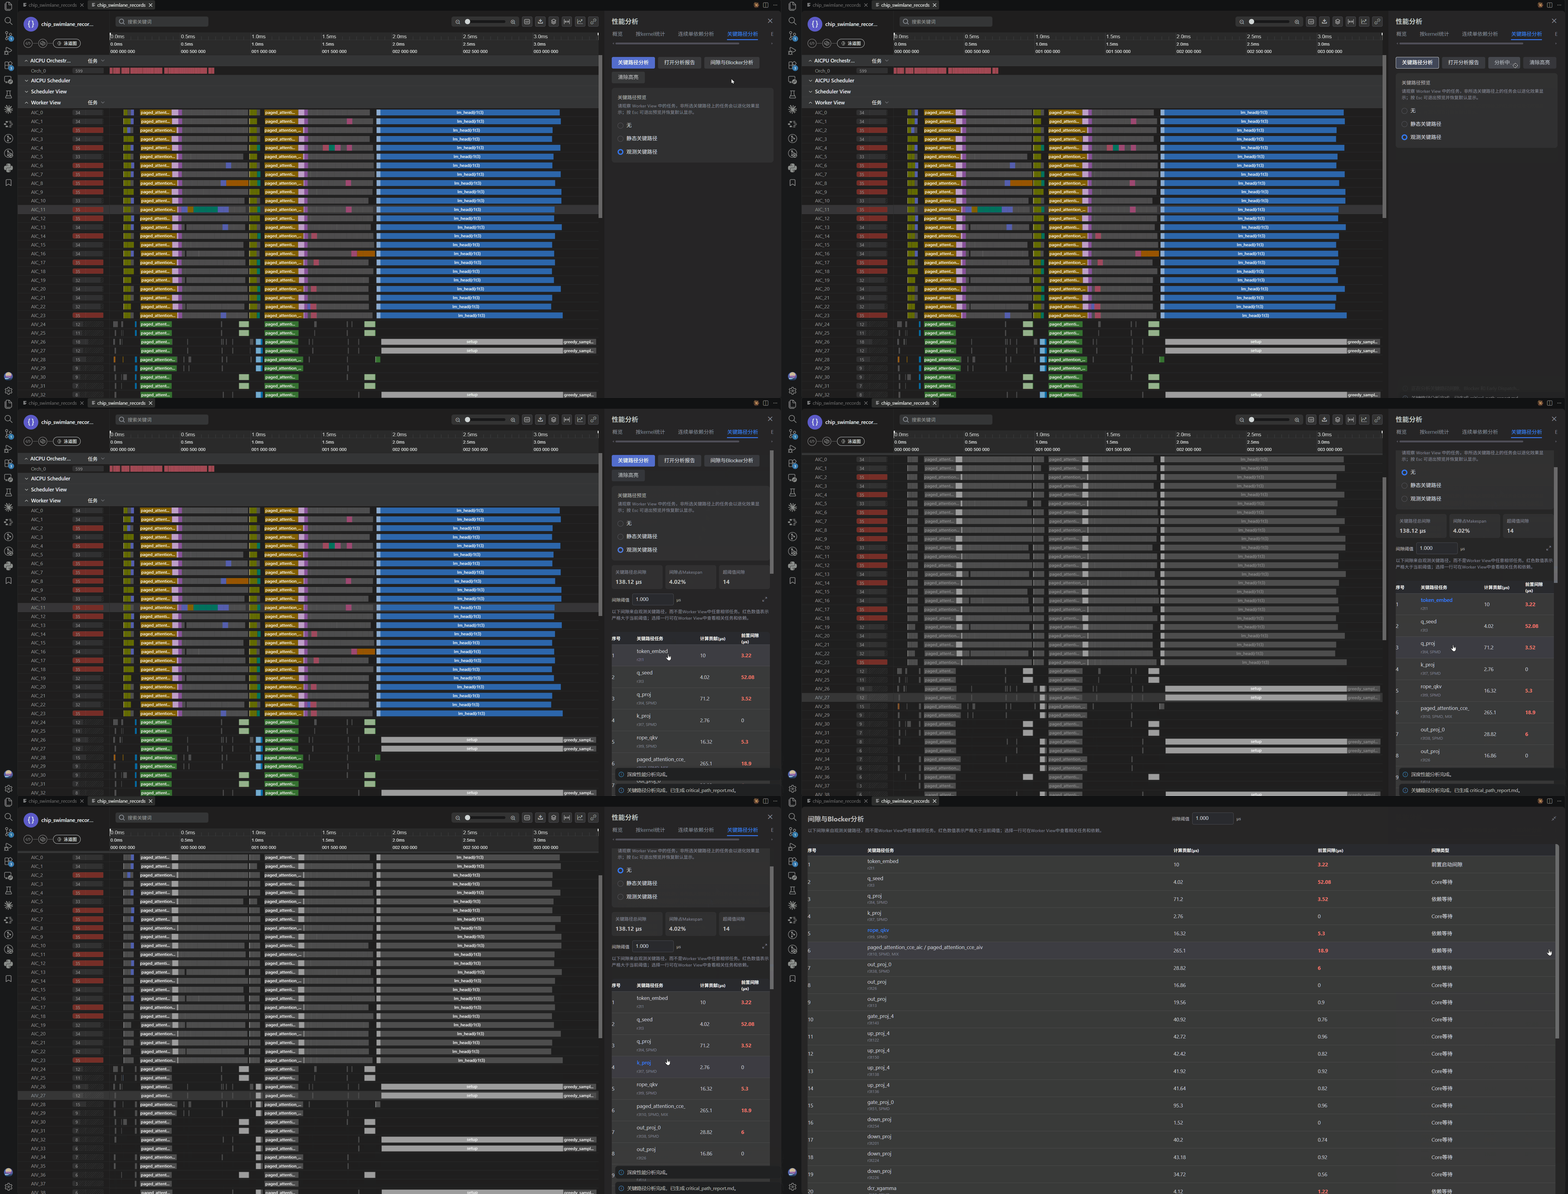
Gap and Blocker Analysis parses an observed critical path and examines the preceding gap for every task on the path. It identifies whether each gap is caused by another task blocking the same core or by the current task waiting for a predecessor to finish. You can set a gap threshold; preceding gaps above the threshold are displayed in red.
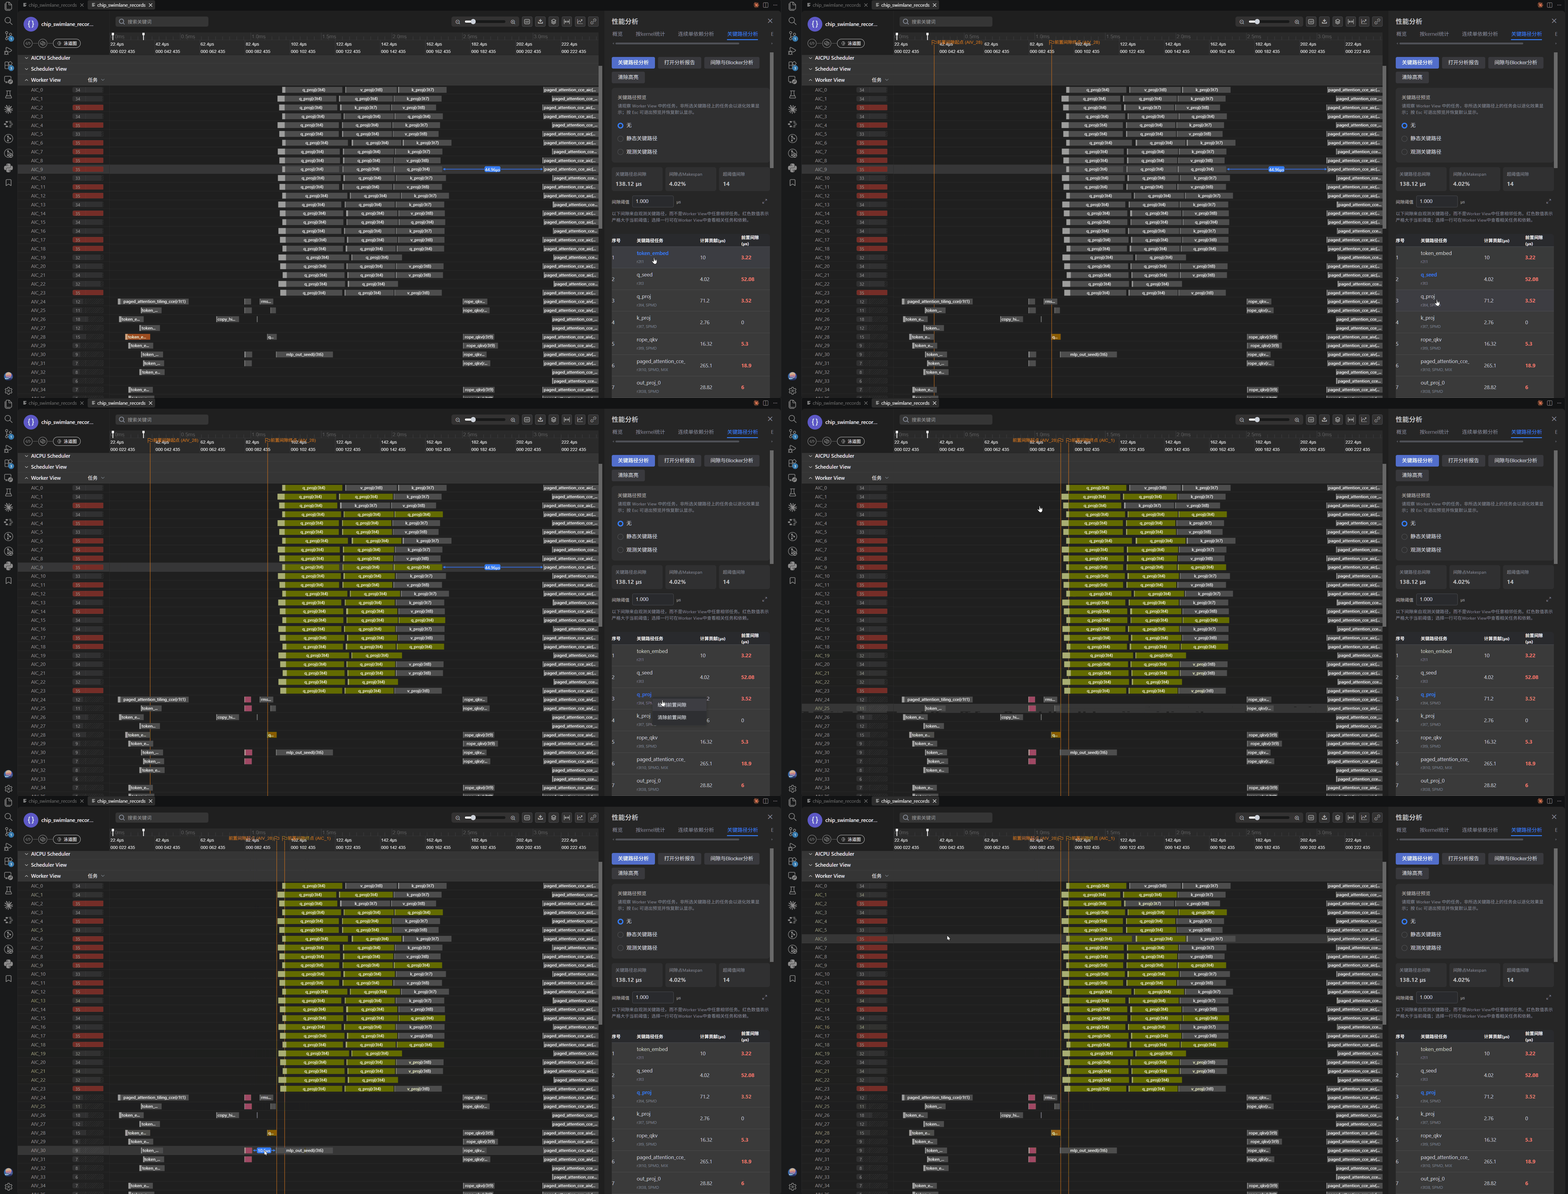
In the analysis table, right-click a task record and select Draw Preceding Gap to mark the gap's start and end. The labeled time markers help you locate the tasks around the gap in the Worker View.
Early Dispatch analysis
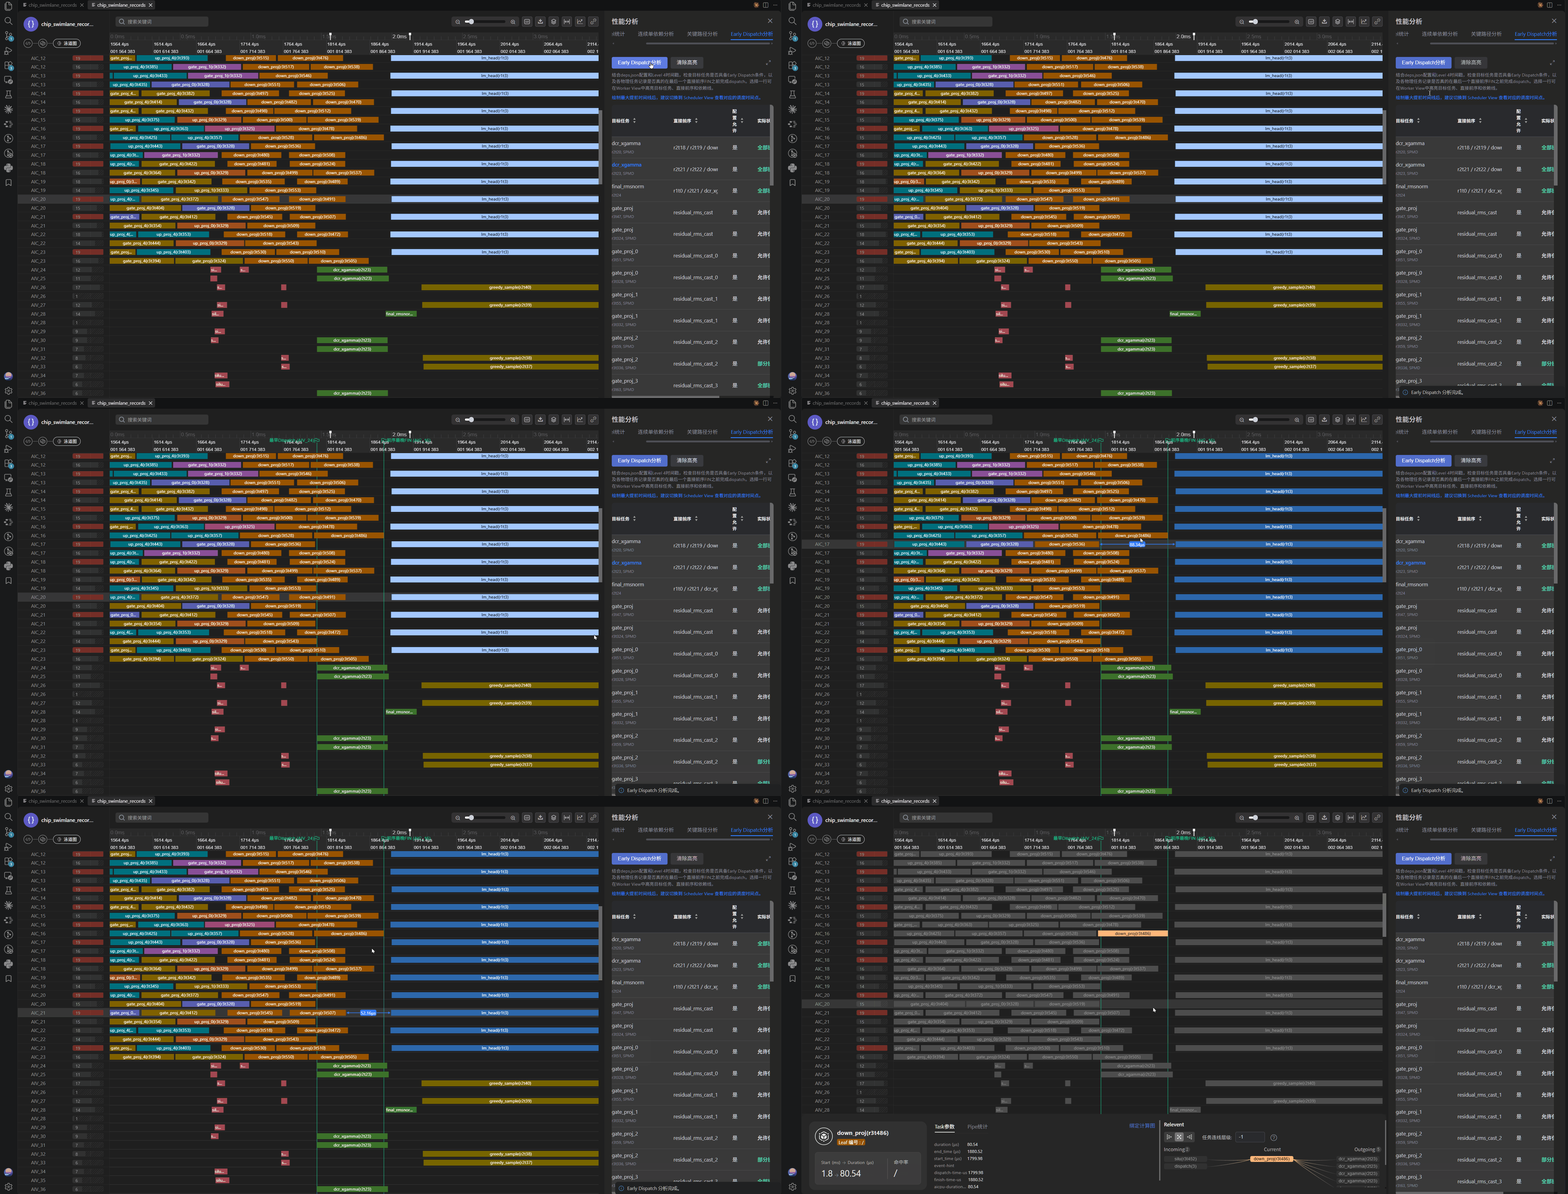
This analysis finds target tasks that match the Early Dispatch configuration and checks whether they were dispatched before the last FIN event among their predecessors. Right-click a task record and select Draw Maximum Lead to mark the start and end of the maximum lead interval. The labeled time markers help you locate that interval in the Scheduler View.
Other operations
- Hover over the left side of a lane to pin that lane to the top;
- export the current swimlane as a PNG image;
- use the top navigation action to open an associated IR Pass Trace found in the current directory, its parent, or a
passes_dump*directory.
| Operation | Function |
|---|---|
| Mouse wheel | Move vertically |
Ctrl + left-button drag |
Move horizontally |
Ctrl + mouse wheel |
Zoom |
Alt + left mouse button |
Measure a time interval manually |
w / s |
Zoom in/out when enabled by the interface configuration |
a / d |
Move horizontally when enabled by the interface configuration |