Quick Start
This section walks through a typical PyPTO 3.0 analysis workflow.
1. Open the output directory
Open a VS Code workspace that contains the PyPTO output files. A typical directory looks like this:
build_out/
└── <case>/
    ├── dfx_outputs/
    │   ├── chip_swimlane_records.json
    │   ├── deps.json
    │   ├── name_map_<timestamp>.json
    │   ├── CPM_static.json             # optional
    │   └── CPM_observed.json           # optional
    └── passes_dump_<timestamp>/
        ├── 00_frontend.py
        ├── 01_<PassName>.py
        └── 02_<PassName>.py
Keep related files in the same directory whenever possible. The extension automatically uses deps.json and name_map*.json to add function names and dependency information to swimlane tasks.
2. Inspect the runtime swimlane
In the Explorer, right-click chip_swimlane_records.json and select PyPTO Toolkit: Open File. The extension creates worker, scheduler, and orchestrator views based on the records actually present in the file.
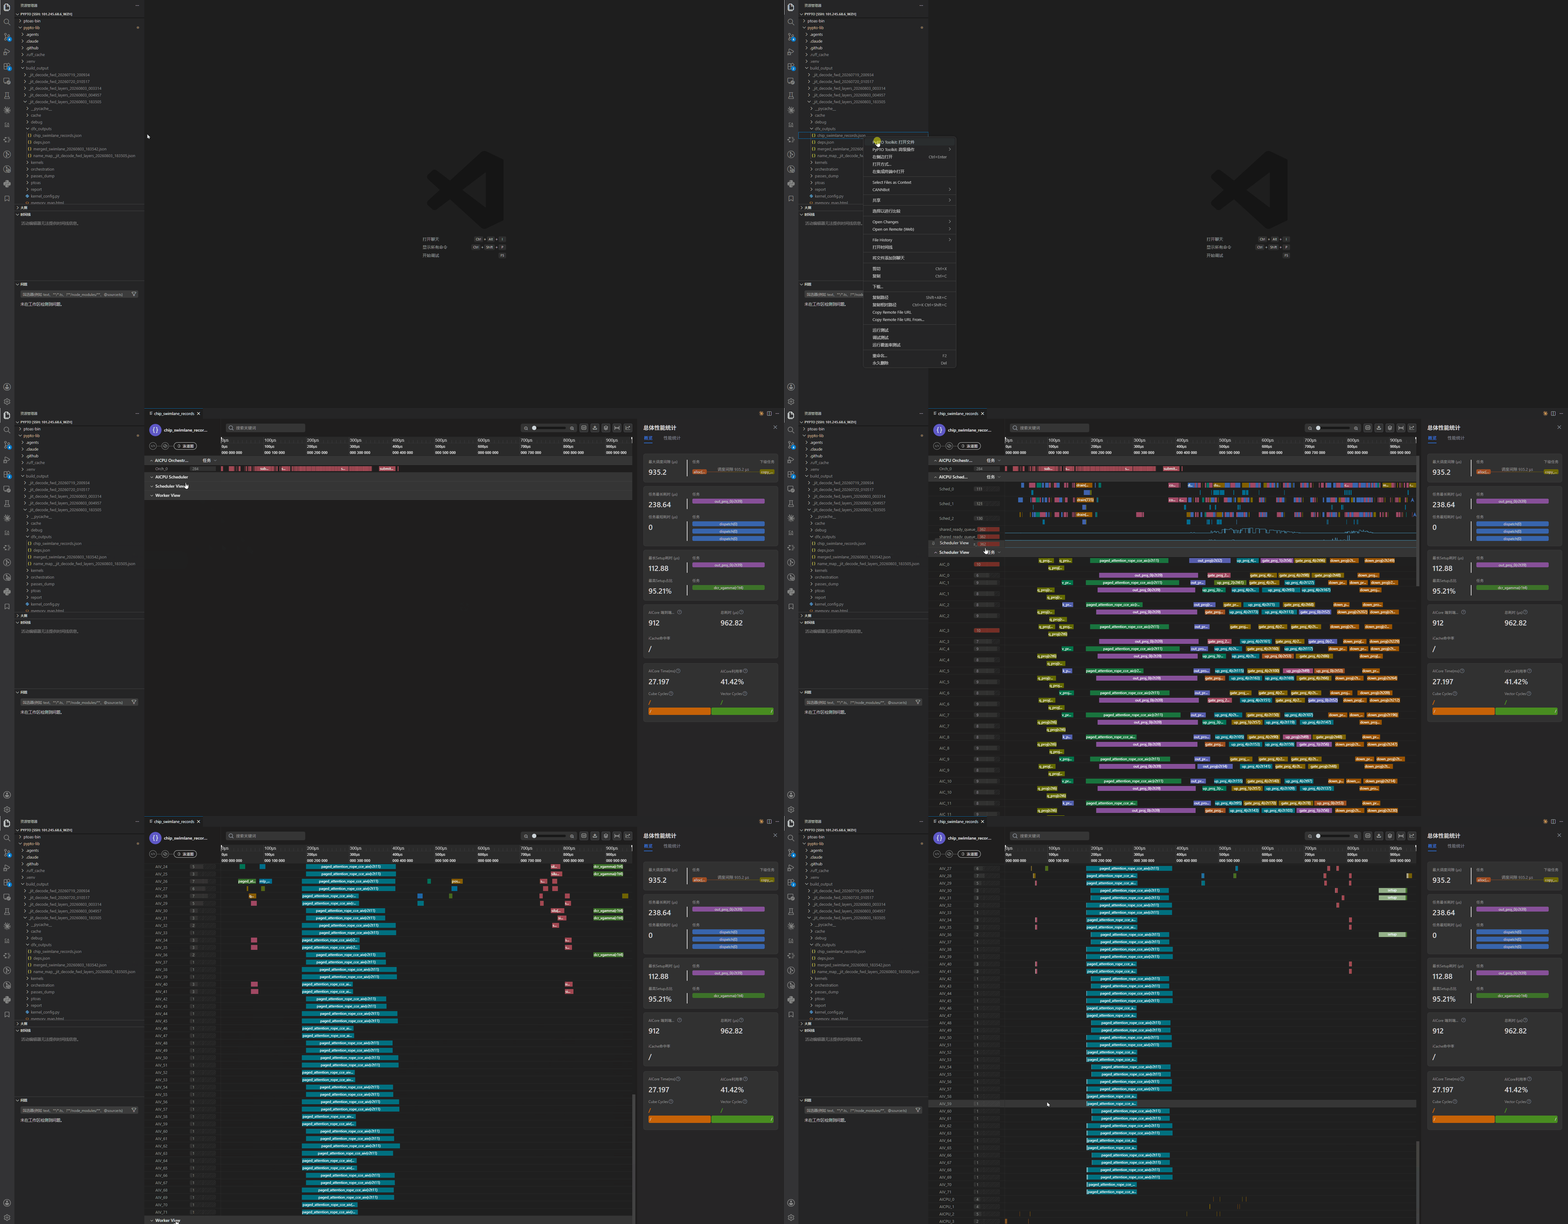
Select a task to inspect its duration, Ring/Task ID, function information, and predecessor and successor relationships. If related files are missing, the swimlane still opens, but some names or dependency lines are unavailable.
3. Inspect a Serving Strace swimlane (optional)
If the output includes serving-strace-swimlane.json, right-click the file and select the extension open action. The performance panel reports task count and average, maximum, and minimum duration by WorkerProcess.
4. Inspect task dependencies
Right-click the file named exactly deps.json in the same directory and select the extension open action. You can search for tasks, switch layouts, and use the Full, Reduced, and Omitted edge modes to inspect redundant dependencies.
5. Inspect IR pass changes
Right-click a directory whose name starts with passes_dump and select the IR Pass Trace action. Select a pass in the left pane to display the difference between the snapshots before and after that pass.
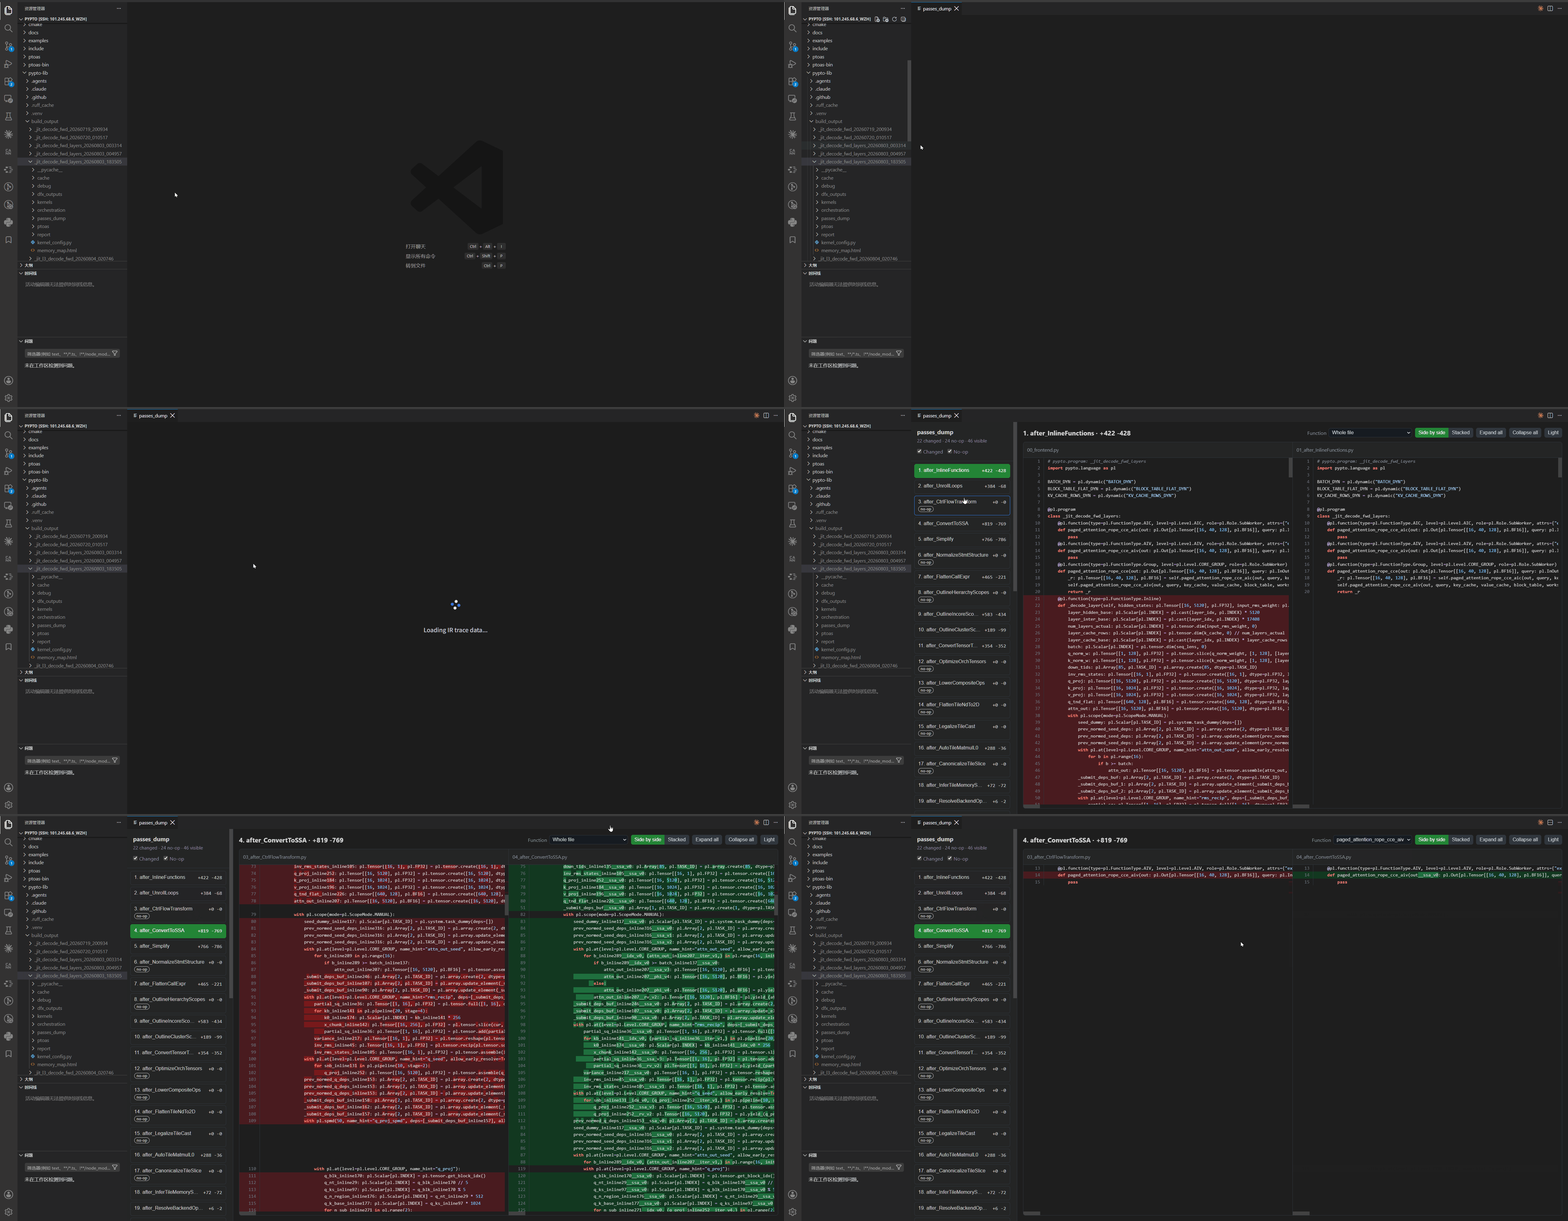
6. Analyze memory reuse
Use memory_map with the relevant pass dump to render an interactive HTML map of on-chip memory. The horizontal axis shows addresses, while the vertical axis shows lifetimes from top to bottom. Each tile shows the live interval and the bytes occupied by its MemRef.